
Free September 2026 Edition · Instant PDF Download
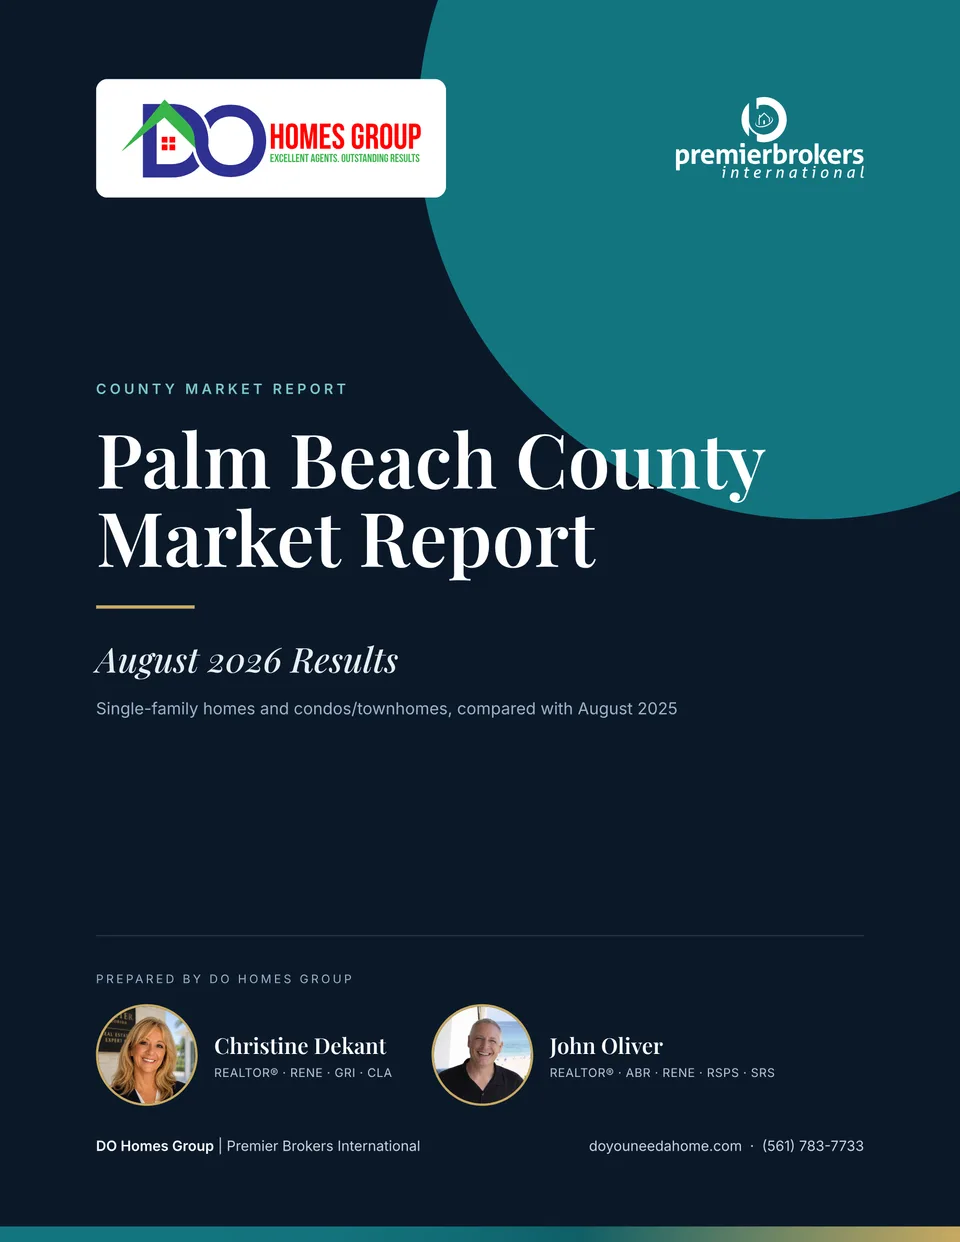
Palm Beach County Market Report
Prices, inventory, pace and negotiating conditions across Palm Beach County, with single-family homes and condos/townhomes measured separately.
$656,000
Single-Family Median
+6.7% year over year
3.6
Single-Family Months of Supply
down from 5.0
$310,000
Condo/Townhome Median
+3.3% year over year
6.8
Condo/Townhome Months of Supply
down from 8.8
September 2026 Palm Beach County market data (BeachesMLS), published in the September 2026 report.
Free — September 2026 Palm Beach County Numbers
Download the September 2026 edition now
The PDF downloads immediately after you submit — no waiting on an email.
September 2026 at a Glance
What the September 2026 Numbers Say
Single-family homes and condos/townhomes behaved like two different markets in Palm Beach County in September 2026. Single-family supply tightened from 5.0 to 3.6 months as active inventory fell 19.6% to 4,481, and median days to contract dropped from 51 to 43, even though closed sales slipped 2.7% to 1,132. The median sale price was $656,000, against $615,000 a year earlier, and the typical sale closed at 94.7% of original list price. That reads as seller-leaning. Condos and townhomes still leave more room to negotiate at 6.8 months of supply, with a median of 53 days to contract and sales closing at 93.2% of original list price, but inventory fell 15.3% and supply is down from 8.8 months, so that room is narrower than it was a year ago.
Key Takeaways From the September 2026 Report
- Single-family: 1,132 closed sales (−2.7%), median $656,000 (+6.7%), 3.6 months of supply, down from 5.0.
- Single-family median days to contract fell from 51 to 43, and sales closed at 94.7% of original list price, up from 93.4%.
- Condo/townhome: 782 closed sales (−4.3%), median $310,000 (+3.3%), 6.8 months of supply, down from 8.8.
- Condo/townhome sales closed at 93.2% of original list price, with a median of 53 days to contract, down from 65.
- Active inventory fell 19.6% for single-family homes and 15.3% for condos and townhomes.
- 44.7% of single-family and 61.1% of condo/townhome closings were paid in cash, calculated from the reported counts.
Statistics are September 2026 Palm Beach County market data (BeachesMLS), published in the September 2026 report. The full PDF includes the complete year-over-year table and our buyer and seller guidance.
Made for Both Sides of the Decision
If You Are Buying
- See how 3.6 months of single-family supply and a 43-day median contract time shape how ready you need to be.
- Understand the negotiating room 6.8 months of condo/townhome supply still gives buyers, and why it is narrower than a year ago.
- Base offers on what homes actually closed at relative to original list price, not on asking prices.
If You Are Selling
- Benchmark against Palm Beach County closings for your property type.
- See why the first list price matters when the typical sale closes below original list price in both segments.
- Know what serious condo buyers ask for first, and have it ready on day one.
Download immediately after completing the form · No obligation
September 2026 data
Palm Beach County, September 2026 vs. September 2025
Every figure below is as reported for Palm Beach County. Percent change is year over year. County numbers blend dozens of very different communities, and your street, building or neighborhood can be moving differently.
| Single-Family Homes | September 2026 | YoY |
|---|---|---|
| Closed sales | 1,132 | −2.7% |
| Paid in cash | 506 | −0.2% |
| Median sale price | $656,000 | +6.7% |
| Original list price received | 94.7% | +1.4% |
| Median days to contract | 43 | −15.7% |
| Active inventory | 4,481 | −19.6% |
| Months of supply | 3.6 | −28.0% |
| Cash share (calculated) | 44.7% | — |
| Condos & Townhomes | September 2026 | YoY |
|---|---|---|
| Closed sales | 782 | −4.3% |
| Paid in cash | 478 | −6.1% |
| Median sale price | $310,000 | +3.3% |
| Original list price received | 93.2% | +1.6% |
| Median days to contract | 53 | −18.5% |
| Active inventory | 5,858 | −15.3% |
| Months of supply | 6.8 | −22.7% |
| Cash share (calculated) | 61.1% | — |
Source: BeachesMLS (Broward, Palm Beaches & St. Lucie Realtors®), September 2026. Cash share is calculated by DO Homes Group from the paid-in-cash and closed-sales counts. These figures describe past closings. They are not a prediction, an appraisal, or investment advice, and a county median does not reflect the value of any specific property.
Still deciding between the Treasure Coast and Palm Beach County? The Relocation Decision Guide compares the areas we serve on price, water access, golf, 55+, HOAs, healthcare and commute.
Christine Dekant
REALTOR® · RENE · GRI · CLA · CPRES
John Oliver
REALTOR® · ABR · RENE · RSPS · SRS
Prepared by
About Christine & John
Christine Dekant and John Oliver lead DO Homes Group at Premier Brokers International in Palm Beach Gardens, serving buyers and sellers across Palm Beach County and the Treasure Coast. They live in the communities they serve, they answer their own phones, and every guide and report on this site is built from the same information they use to price listings and advise their own clients.
Frequently Asked Questions
What data is in the Palm Beach County Market Report?
September 2026 county-level figures for Palm Beach County single-family homes and condos/townhomes: closed sales, paid-in-cash sales, median sale price, percent of original list price received, median days to contract, active inventory and months of supply, each compared with September 2025, plus guidance for buyers and sellers. Source: BeachesMLS (Broward, Palm Beaches & St. Lucie Realtors®).
Does it include figures for my city or neighborhood?
No. Every figure is a Palm Beach County total. County numbers blend dozens of very different communities, and your street, building or neighborhood can be moving differently. For a specific area, we pull the recent closed sales and active competition there with you.
Does it cover condos as well as houses?
Yes. Single-family homes and condos/townhomes are reported separately, because in September 2026 they were behaving like two different markets: 3.6 months of supply for single-family homes against 6.8 for condos and townhomes.
Is the report really free?
Yes. Enter your name and email and the PDF downloads immediately — no payment, no obligation, and your information is never shared or sold.
Who prepares the report?
Christine Dekant and John Oliver, REALTORS® with DO Homes Group at Premier Brokers International, serving buyers and sellers across Palm Beach County and the Treasure Coast.
Keep Exploring
More From DO Homes Group
This report describes past market activity in Palm Beach County for the months shown. It is not an appraisal, a prediction of future prices, or financial, legal or investment advice. County-level medians do not reflect the value of any specific property. Cash-share percentages were calculated by DO Homes Group from the reported closed-sales and paid-in-cash counts. Information is believed reliable but not guaranteed. If your property is currently listed with a real estate broker, this is not intended as a solicitation of that listing.