Free August 2026 Edition · Instant PDF Download
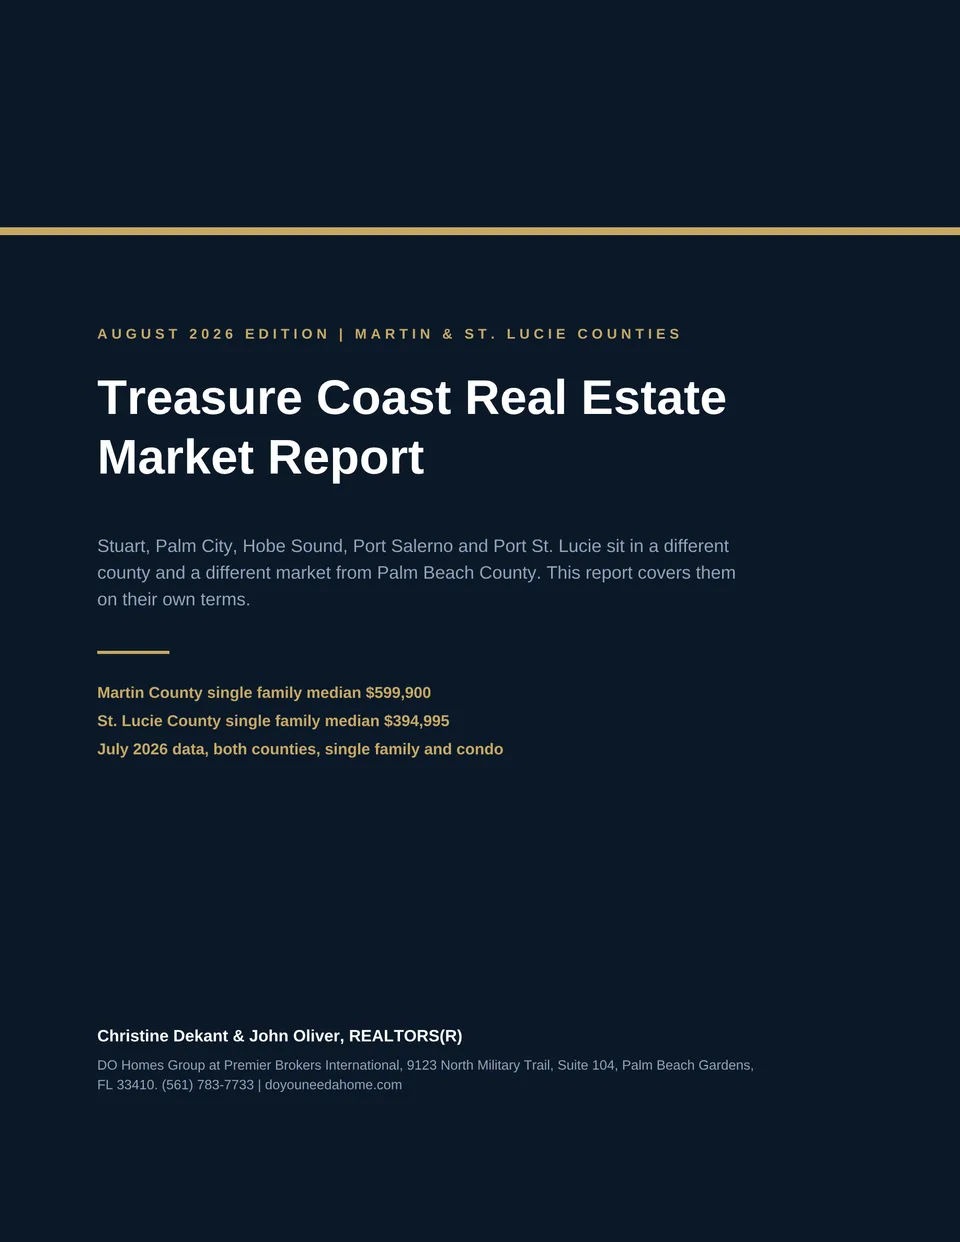
Treasure Coast Real Estate Market Report
Stuart, Palm City, Hobe Sound, Port Salerno and Port St. Lucie sit in a different county and a different market from Palm Beach County. This report covers them on their own terms.
$599,900
Martin County Median
single family, +4.3% year over year
$394,995
St. Lucie County Median
single family, +2.6% year over year
3.7
Martin Months of Supply
down from 5.6
4.9
St. Lucie Months of Supply
down from 5.7
July 2026 Martin County and St. Lucie County market data (BeachesMLS), published in the August 2026 report.
Free August 2026 Treasure Coast Market Report
Download the August 2026 edition now
The PDF downloads immediately after you submit — no waiting on an email.
July 2026 at a Glance
Martin and St. Lucie, on Their Own Terms
The Treasure Coast is not a cheaper version of Palm Beach County — it is a different market moving on its own cycle. In July 2026 both counties tightened. Martin County single family closings rose 23.4% while inventory fell 21.3%, taking months of supply from 5.6 to 3.7 and the median to $599,900. St. Lucie moved more gently — closings up 2.4%, supply down from 5.7 to 4.9 months, median $394,995 — but its sellers received 96% of original list price, the strongest figure in either county. Condos are the split story: supply fell hard in both counties, yet Martin’s median dropped 10.7% while St. Lucie’s rose 13.3%, on 77 and 82 closings respectively. This report covers each county separately so the numbers you are reading describe the market you are actually buying or selling in.
Key Takeaways From the August 2026 Report
- Martin County single family: median $599,900 (+4.3%), 211 closings (+23.4%), 3.7 months of supply — down from 5.6.
- St. Lucie County single family: median $394,995 (+2.6%), 517 closings (+2.4%), 4.9 months of supply — down from 5.7.
- Inventory fell in all four segments, by 8.2% to 21.3% year over year.
- St. Lucie single family sellers received 96% of original list price — the strongest in either county; Martin condo sellers received 92.2%, the weakest.
- St. Lucie single family is the one segment where time moved toward buyers: 63 median days to contract, up from 52.
- Two of every three Martin County condo closings were all-cash, and just over half of St. Lucie’s.
- St. Lucie condos at 7.8 months of supply are the last clear buyer’s window — down from 10.6 a year ago.
Statistics are July 2026 Martin County and St. Lucie County market data (BeachesMLS), published in the August 2026 report. The full PDF includes the complete year-over-year table and our buyer and seller guidance.
Made for Both Sides of the Decision
If You Are Buying
- See Martin and St. Lucie inventory and negotiating conditions separately, rather than inferring them from Palm Beach County.
- Understand where the two counties are in their own cycle.
- Know what sellers are conceding from asking price on this side of the county line.
If You Are Selling
- Benchmark against your own county, not the county to the south.
- See how long comparable homes are taking to go under contract.
- Understand which property types are absorbing and which are sitting.
Download immediately after completing the form · No obligation
July 2026 data
Both Counties, Side by Side
A balanced market is roughly 5.5 months of supply. Below that, conditions favor sellers; above it, buyers. That one number is the fastest read on any of the four segments here.
Martin County
Includes Stuart, Palm City, Hobe Sound, Port Salerno, Jensen Beach.
| Single Family Homes | July 2026 | vs. 2025 |
|---|---|---|
| Median sale price | $599,900 | +4.3% |
| Closed sales | 211 | +23.4% |
| Paid in cash | 82 of 211 closings (38.9%) | +5.1% |
| Percent of original list price received | 94.7% | +2.5% |
| Median days to contract | 43 | -14.0% |
| Active inventory | 696 | -21.3% |
| Months supply of inventory | 3.7 | -33.9% |
| Townhouses & Condos | July 2026 | vs. 2025 |
|---|---|---|
| Median sale price | $230,000 | -10.7% |
| Closed sales | 77 | +6.9% |
| Paid in cash | 51 of 77 closings (66.2%) | +64.5% |
| Percent of original list price received | 92.2% | +2.4% |
| Median days to contract | 70 | -24.7% |
| Active inventory | 514 | -19.1% |
| Months supply of inventory | 5.6 | -34.1% |
St. Lucie County
Includes Port St. Lucie, Fort Pierce, Tradition.
| Single Family Homes | July 2026 | vs. 2025 |
|---|---|---|
| Median sale price | $394,995 | +2.6% |
| Closed sales | 517 | +2.4% |
| Paid in cash | 134 of 517 closings (25.9%) | +3.1% |
| Percent of original list price received | 96% | +1.8% |
| Median days to contract | 63 | +21.2% |
| Active inventory | 2,271 | -8.2% |
| Months supply of inventory | 4.9 | -14.0% |
| Townhouses & Condos | July 2026 | vs. 2025 |
|---|---|---|
| Median sale price | $319,950 | +13.3% |
| Closed sales | 82 | +17.1% |
| Paid in cash | 43 of 82 closings (52.4%) | +30.3% |
| Percent of original list price received | 94.1% | +5.4% |
| Median days to contract | 93 | +3.3% |
| Active inventory | 641 | -16.4% |
| Months supply of inventory | 7.8 | -26.4% |
Source: BeachesMLS July 2026 Market Snapshot. Year-over-year percentages are calculated from the published July 2026 and July 2025 values. Cash share is derived from the paid-in-cash and closed-sales counts. Market data describes past closings and is not a prediction, or an appraisal of any specific property.
What the numbers mean
Read the Market, Not Just the Median
Martin County: What the July Numbers Say
Martin County's single family market tightened sharply in July 2026. Closed sales rose 23.4% over July 2025 to 211 while active inventory fell 21.3% to 696 homes - the combination that pushed months of supply from 5.6 down to 3.7. The median sale price reached $599,900, up 4.3%, sellers received 94.7% of original list price, and the median home went under contract in 43 days, a week faster than a year ago. On the townhouse and condo side the picture is more mixed. Closings rose 6.9% to 77 and inventory fell 19.1%, cutting months of supply from 8.5 to 5.6, but the median sale price fell 10.7% to $230,000. With only 77 closings in the month, a shift in which buildings and price tiers happened to trade can move that median on its own, so it is better read alongside the 92.2% of original list price sellers received than as a standalone signal of falling values.
St. Lucie County: What the July Numbers Say
St. Lucie County's single family market moved more gently. Closed sales rose 2.4% to 517 and inventory eased 8.2% to 2,271 homes, taking months of supply from 5.7 to 4.9. The median sale price rose 2.6% to $394,995 - still the most affordable of the three counties we serve - and sellers received 96% of original list price, the strongest list-price performance on either side of the county line. The one metric moving toward buyers is time: the median home took 63 days to go under contract, up from 52 a year ago. The condo and townhouse market is the county's sharpest mover. Closings rose 17.1% to 82, inventory fell 16.4% to 641, and months of supply dropped from 10.6 to 7.8. The median sale price rose 13.3% to $319,950, though with 82 closings that figure carries the same small-sample caution as Martin County's.
Negotiating Conditions Across Both Counties
A balanced market is roughly 5.5 months of supply. By that yardstick, Martin County single family homes at 3.7 months are firmly seller's territory, and St. Lucie single family at 4.9 months is close behind. Martin County condos at 5.6 months sit almost exactly at balance, and St. Lucie condos at 7.8 months remain the one segment where buyers still hold real leverage - though that leverage has shrunk faster than anywhere else, down from 10.6 months a year ago. Percent of original list price received tells the same story from the other direction: St. Lucie single family sellers are conceding least at 96%, while Martin County condo sellers are conceding most at 92.2%, which is where a prepared buyer will find the most room.
Cash Buyers
Cash concentrates in condos on both sides of the county line. Two of every three Martin County condo closings were cash purchases (51 of 77, up 64.5% year over year), and just over half of St. Lucie's were (43 of 82). Single family cash activity is far lower - 38.9% in Martin County and 25.9% in St. Lucie. That matters for financed condo buyers in two ways: you are competing against offers with no appraisal and no loan contingency, and a building that a large share of cash buyers are choosing is not necessarily a building your lender will approve. Confirm financing eligibility for the specific building before you write.
If You Are Buying
Inventory fell in all four segments, so the era of waiting for more choice has ended on the Treasure Coast. If you want a single family home in Martin County, 3.7 months of supply means the well-priced ones will not sit and your negotiating room is on terms rather than price. St. Lucie single family is the better-supplied market of the two, and the jump to 63 days on market means the homes that are lingering are genuinely negotiable. If you are buying a condo, St. Lucie's 7.8 months of supply is the best buyer's window in either county - but arrive with the association's paperwork requested and your lender's building review already underway, because that is what decides whether a condo purchase closes.
If You Are Selling
Single family sellers in both counties are in the strongest position in several years: supply down, sales up, and buyers conceding less off list price than they did in July 2025. Price to this year's comparables rather than last year's and the data says the market will meet you. Condo sellers need to be more precise. Martin County's median fell 10.7% year over year and its sellers are conceding the most of any segment, so the pricing conversation there starts with which buildings are actually trading and why. In both counties, the buildings with completed inspections, funded reserves and stable dues are the ones moving - having that paperwork assembled before you list is now part of the pricing strategy, not the closing paperwork.
Deciding between the Treasure Coast and Palm Beach County in the first place? The Relocation Decision Guide compares all fourteen areas we serve on price, water access, golf, 55+, HOAs, healthcare and commute.

Christine Dekant
REALTOR® · RENE · GRI · CLA · CPRES

John Oliver
REALTOR® · ABR · RENE · RSPS · SRS
Prepared by
About Christine & John
Christine Dekant and John Oliver lead DO Homes Group at Premier Brokers International in Palm Beach Gardens, serving buyers and sellers across Palm Beach County and the Treasure Coast. They live in the communities they serve, they answer their own phones, and every guide and report on this site is built from the same information they use to price listings and advise their own clients.
Frequently Asked Questions
Which areas does the Treasure Coast Market Report cover?
Martin County — including Stuart, Palm City, Hobe Sound and Port Salerno — and St. Lucie County, including Port St. Lucie. It is a single combined report with a separate section for each county.
Why is this separate from the Palm Beach County reports?
Because it is a different market. Martin and St. Lucie counties are a different MLS from Palm Beach County, and their prices, inventory and pace do not track Palm Beach County’s. Offering a Palm Beach County report to a Stuart buyer would be giving them the wrong county’s numbers.
Does it cover condos as well as houses?
It covers single-family homes for both counties, and condos and townhomes where the sample size supports reliable figures. Where it does not, the report says so rather than publishing a number built on a handful of sales.
How often is it updated?
Monthly, alongside the Palm Beach County reports. Each edition is prepared by Christine Dekant and John Oliver of DO Homes Group from the latest BeachesMLS market snapshot for Martin and St. Lucie counties.
Why does the report caution about the condo medians?
Because the samples are small. Martin County recorded 77 condo and townhouse closings in July 2026 and St. Lucie 82, so which buildings and price tiers happened to trade in a given month can move the median on its own. The report reads those medians alongside inventory, months of supply and percent of original list price received rather than treating them as a standalone signal.